

Nýjustu færslur
- Og við gamlingjarnir verðum syngjandi glaðir. Heiður sé Heil...
- Meira en 300 tegundir af ormum búa í þörmum, lifur, lungum, h...
- Alls ekki fækka sýslumanns embættum. Að einhver fái alræðisva...
- Trump verður að setja strax endurfjármögnun til að skapa stör...
- Svona náði $1 dollara landið öllum verksmiðjunum og öllum upp...
- Ræði við copilot eins og sköpun. Samkvæmt tveggja raufa tilra...
- Ég sá að allt var í vandræðum, hugsaði eru mótherjar á lyfjum...
- Allir verðir Ísraels eru blindir, þeir vita ekkert, þeir eru ...
- Sýnt hvernig hægt er að láta gervitungl og aðra tækni, líkja ...
- Þá sýndu þeir okkur hvernig til dæmis 20.000 atkvæða lækkun v...
- Engin noti harp vopnið til að búa til flóðbylgjur til að eyði...
- Nú er tíminn kominn, allir fari að leita leiða til að við fól...
- Ef allir læra um bókhaldið, peningaprentunina og styðja stjór...
- Bretar verða að greiða fyrir vind rafmagnið þótt þeir geti ek...
- Gyðingunum, sem voru reknir út úr löndum Islam 1948, var stra...
Eldri færslur
2025
2024
2023
2022
2021
2020
2019
2018
2017
2016
2015
2014
2013
2012
Júlí 2025
| S | M | Þ | M | F | F | L |
|---|---|---|---|---|---|---|
| 1 | 2 | 3 | 4 | 5 | ||
| 6 | 7 | 8 | 9 | 10 | 11 | 12 |
| 13 | 14 | 15 | 16 | 17 | 18 | 19 |
| 20 | 21 | 22 | 23 | 24 | 25 | 26 |
| 27 | 28 | 29 | 30 | 31 |
Heimsóknir
Flettingar
- Í dag (3.7.): 4
- Sl. sólarhring: 7
- Sl. viku: 88
- Frá upphafi: 174587
Annað
- Innlit í dag: 1
- Innlit sl. viku: 59
- Gestir í dag: 1
- IP-tölur í dag: 1
Uppfært á 3 mín. fresti.
Skýringar
Það sem við lærðum afinflúensufaraldrinum 1918.
https://medium.com/@tomaspueyo/coronavirus-act-today-or-people-will-die-f4d3d9cd99ca
Learnings from the 1918 Flu Pandemic
klikka mynd stærri

1*
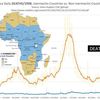
Philadelphia var sein til aðgerða og margir dóu.
Berðu það saman við St. Louis með viðbúnað strax.
Denver greip til varna, en hætti svo við.
Denver fékk annan topp stærri en þann fyrri
You can see how Philadelphia didn’t act quickly, and had a massive peak in death rates.
Compare that with St Louis, which did.
Then look at Denver, which enacted measures and then loosened them.
They had a double peak, with the 2nd one higher than the first.
Það orsakaði fleiri dauðsföll í Denver í inflúensufaraldri 1918.
klikka mynd stærri

2
*We noted that, in some cases, outcomes appear to have correlated with the quality and timing of the public health response. The contrast of mortality outcomes between Philadelphia and St. Louis is particularly striking (Fig. 1). The first cases of disease among civilians in Philadelphia were reported on September 17, 1918, but authorities downplayed their significance and allowed large public gatherings, notably a city-wide parade on September 28, 1918, to continue. School closures, bans on public gatherings, and other social distancing interventions were not implemented until October 3, when disease spread had already begun to overwhelm local medical and public health resources. In contrast, the first cases of disease among civilians in St. Louis were reported on October 5, and authorities moved rapidly to introduce a broad series of measures designed to promote social distancing, implementing these on October 7. The difference in response times between the two cities (≈14 days, when measured from the first reported cases) represents approximately three to five doubling times for an influenza epidemic. The costs of this delay appear to have been significant; by the time Philadelphia responded, it faced an epidemic considerably larger than the epidemic St. Louis faced. Philadelphia ultimately experienced a peak weekly excess pneumonia and influenza (P&I) death rate of 257/100,000 and a cumulative excess P&I death rate (CEPID) during the period September 8–December 28, 1918 (the study period) of 719/100,000. St. Louis, on the other hand, experienced a peak P&I death rate, while NPIs were in place, of 31/100,000 and had a CEPID during the study period of 347/100,000. Consistent with the predictions of modeling, the effect of the NPIs in St. Louis appear to have had a less-pronounced effect on CEPID than on peak death rates, and death rates were observed to climb after the NPIs were lifted in mid-November (7–9).
Egilsstaðir, 20.03.2020 Jónas Gunnlaugsson


Bæta við athugasemd [Innskráning]
Ekki er lengur hægt að skrifa athugasemdir við færsluna, þar sem tímamörk á athugasemdir eru liðin.