Höfundur

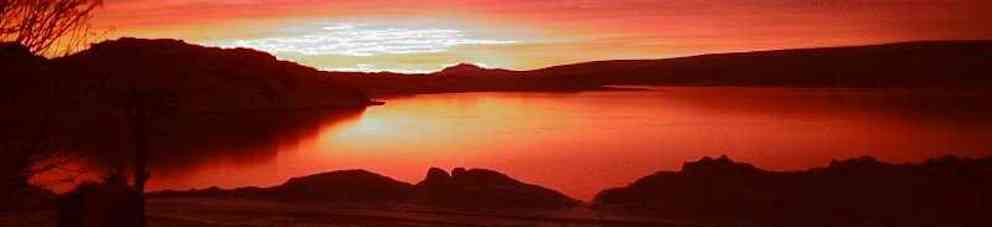
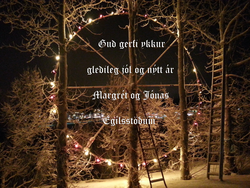
Gleðileg Jól frá
Egilsstöðum.
24.12.2023,
slóð,
,
Hver selur peningaprentunina, peningabókhaldið til einstaklinga, sem þykjast svo lána fólkinu og ríkinu.
Hringurinn - Tveir jólasveinar? - Jólin 2023

![]() Við erum að reyna að bjarga okkur öllum, og líka okkur gömlu svindlurunum.
Við erum að reyna að bjarga okkur öllum, og líka okkur gömlu svindlurunum.
Alls ekki sprengja upp veröldina, heilmyndina, háskóla leikritið sem við erum leikendur í.
![]() Notum aðferðirnar hans Mandela og klárum kennslu leikritið, heilmyndina öllum til sóma og látum Karlinn með skeggið um dóminn.
Notum aðferðirnar hans Mandela og klárum kennslu leikritið, heilmyndina öllum til sóma og látum Karlinn með skeggið um dóminn.
Það er búið að hringla í tölvunni minni í geymslu diskum og bloggunum á netinu. Sum bloggin eru röng, og koma með annarra skoðanir.
Egilsstaðir, 11.10.2023 Jónas Gunnlaugsson
Velt vöngum, Ef eitthvað er hér sem er til upplýsingar, og til góðs, þá er um að gera að dreifa því sem víðast. Við verðum að læra um fjármálin og breyta svo fjármálakerfinu.
hitt bloggið, slóðin er hér neðan við, bloggin eru tvö,
the path to the other blog is here

000
** **
**
https://jonasg-egi.blog.is/blog/jonasg-egi/entry/2255795/
000
Nikola Tesla var einn af þeim, sem fluttu þjóðunum blessun og leystu fólkið úr ánauð þekkingarleysisins? Þekkingin skapar allsnæktir. Nústaðreyndatrúin stóð á móti Jesú og Nikola Tesla. Við skulum færa Jesú og Tesla aftur inn í skólanna. 20.12.2017 | 18:24 Viðtal við Nikola Tesla 1899
English
24.11.2017 | 22:09
31.8.2018 | 09:28
000
English

7.10.2017 | 13:26
***
Hér er eðlisfræði lífsins 1. 2. 3.
------Jóhannesarguðspjall, Kafli 14, vers 6------
----Velt vöngum um Bíblíuna. Tönn fyrir tönn. Fyrirgefning fyrir fyrirgefningu. EINFALT----
28.12.2017 | 10:06
Þessa slóð verður að lesa.
Learn, learn, learn. Læra, læra, læra.
This link you must read.
My homepage:
hitt bloggið hér neðan við, bloggin eru tvö
http://jonasg-egi.blog.is/blog/jonasg-egi/image/1298552/

Hér er**ég slóð
Og það besta, ég lánaði þér ekki neitt.
**
MYNDIN SEM VIÐ LIFUM Í HOLOGRAMINU ER AÐEINS TIL Í HUGSKOTI OKKAR.
**
Verum fulltrúar gnægta, lausna.
*--- Spuni ---*
****
****
****
**** Fjármálakerfið er einfalt, ekki láta flækja það til að blekkja okkur. ** **
**
The Two Step Plan - Nýtt peningakerfi. Eg. 07.12.2011 jg
****
Nýtt peningakerfi. Eg. 07.12.2011 jg
Islam frá árinu 700 til 2015, mjög fróðlegt.
Það er eins og við getum ekki sagt í orðum, hvert vandamálið er.
**
Skapararnir og Nú staðreynda trúar fólkið.
**
**
**
Íbúðalánasjóður, láttu ekki plata þig.
****
****
Nótur, kvittanir, peningur er færanlegt bókhald.
****
Israel, 29.01.2009. endurtekið
****
**** **** ****
**** **** ****
Israel, 29.01.2009. endurtekið
Snúðu jörðinni og stækkaðu eða minnkaðu með músinni.
Ný nú mynd kemur upp þegar þú endurræsir, ýtir á refresh, (F5).
****
****
Glenna --
Pottur --
MUNA --
********
MUNA, bankar græddu ekkert. --
********
Gerð --
ooo
Mikil blessun Jesaja 9:1-20 ---
****
Bólur, "KLIKK, PIKK, BRELLA, BRELLA."
****
Try to understand the money masters
We must learn a " New World Order "
Peningar eru flutningabílar. ----
Fjármálakerfið, fjárfestar, tæmdu fésýslufyrirtækin -----
****
ENGLISH -
Paper money -- (Stjórnarskrá - peningana -- Constitution - Of money jg) ----
Central-banks ----
Try to understand the money masters
Learn, learn, learn. Læra, læra, læra.
ENGLISH
http://www.herad.is/y04/1/2011-10-05-Central-banks-05.htm
****
****
Verum fulltrúar gnægta, lausna.
**** **** ****
**** **** ****
---- SJÓÐUR "0"
Af hverju talar engin um "KREPPUFLÉTTUNA."------****Ríkisstjórnin**** - -----Kreppufléttan 2013 og miðbankinn--------Kreppu, verðbólgu, verðhjöðnunar fléttan------Getum við skilið hvernig spilað er með okkur?------Jóhannesarguðspjall, Kafli 14, vers 6---- 12 Year Old Girl Paints Heaven, Unbelievable! ---- Hér er sýnishorn af sálum sem eru að koma í stórum stíl inn í "mannheima" til að kenna okkur hinum.---- http://www.youtube.com/watch?v=Xzq4PHJoItU---- Fluga á vegg.----Eignirnar----Kreppufléttan, læra---- Thomas Jefferson sagði okkur þetta allt saman. ----Miscellaneous, Ýmislegt----Dept is slavery Go to the dot “.”Money As Debt The deptindustry It's Not a Deficit, It's New Money ----Ríkisstjórnin----Kosningamálin verða.----icesave-2 - Hótun----Skuldir einkabankanna----Fléttan ----Ámynning - Eignirnar færðar úr fasteigninni yfir í töluna sem bankinn skrifaði í tölvuna hjá sér. ---- Loftpeningar ----Þú elskar að láta plata þig. ----Miðríkið----Merkilegt ----Mjög merkilegt, peningaleikur. ----"Arðurinn" eru eigur fólksins, eigur heimilanna, eigur atvinnuveganna ---- MUNA ----Bóndabær----Restoring our Financial Sovereignty A New Monetary System----Einfalt peningakerfi.----www.herad.is ----http://www.ismennt.is/not/jonasg/jg/jg06/----http://www.herad.is/y04/1/----
Nýjustu færslur
- Hér er hægt að fá að vita heilmikið um það ""hvað varð um pen...
- Ef allir læra um bókhaldið, peningaprentunina og styðja stjór...
- Er heimurinn loks búinn að missa vitið? Úkrainu stríðið hóf...
- " Við erum komin nálægt því að búa til svokölluð krabbameinsb...
- Göng beint á Seyðisfjörð og beint á Mjóafjörð, áfram beint á ...
- Það væri nánast "ómögulegt" að stöðva þróun gervigreindar og ...
- Valgerður tók lyfið Ivermectin, til að forðast Covid-19, lækn...
- Ítrekuð alvarleg atvik vegna hælisleitenda í Fjölbrautarskóla...
- Alls ekki svara þótt hent sé kjarnorku sprengjum, heldur reyn...
- Ert þú syndlaus, villt þú ekki hlusta á þann góða? Hér er ath...
- Nýlega kom hinsvegar í ljós í forklínískum rannsóknum að engi...
- Þetta upphlaup gagnvart Ráðfrúnni er til að við gleymum að fj...
- Verður að skilja, að leiðandi Bolsjevíkar, sem tóku yfir Rúss...
- How the Russian soul can save the American Empire - If we don...
- Munum að fortíðin, nútíminn og framtíðin eru nú, allt er í h...
Eldri færslur
2024
2023
2022
2021
2020
2019
2018
2017
2016
2015
2014
2013
2012
Apríl 2024
Heimsóknir
Flettingar
- Í dag (25.4.): 2
- Sl. sólarhring: 2
- Sl. viku: 37
- Frá upphafi: 169381
Annað
- Innlit í dag: 2
- Innlit sl. viku: 20
- Gestir í dag: 2
- IP-tölur í dag: 2
Uppfært á 3 mín. fresti.
Skýringar
2011 okt 4_Science & Cocktails_Jørgen Peder Steffensen3
https://www.youtube.com/watch?v=nGA4Clu4-V8&t=8s
Birt 5. nóv. 2011
Iskerner og klimaændringer. En fortælling fra en 3cm i diameter, 3km lang iskerne fra Grønland. Science & Cocktails er tilbage efter sommerferien. Vi begynder med en ekspedition til en af verdens mest øde egne: Nordpolen. Jørgen Steffensen, professor ved Niels Bohr instituttet, vil berette hvordan en simpel iskerne fra Grønland kan fortælle os om fortidens klimaændringer, forurening og vulcanudbrud. Efter dette vil der kunne stilles spørgsmål i baren, hvor Lars E. Lyndgaard Schmidt og hans team serverer gammeldags cocktails, næsten så gamle som iskernen selv. Andy Benz indtager scenen med kontrabass og spontane elektroniske lyde. (alle foredrag holdes på engelsk) http://www.youtube.com/watch?v=Y0wACf... http://www.myspace.com/flowingincircles
000
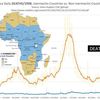
Fyrir 7000 árum var hitinn eitthvað hærri fram til fyrir 4000 árum, þá fór hitinn lækkandi þanngað til fyrir 2000 árum, þá hækkaði hitinn nokkuð aftur að Víkinga tímanum fyrir 1000 árum, um árið 900.
Þá lækkaði hitinn til ársins 1600, en hækkaði aðeins um árið 1700, og lækkaði svo aftur í lægsta hitann um 1850.
Á þeim tíma lærðu menn að taka ljósmyndir, og eru einhverjar kuldamyndir til frá þeim tíma.
Við sjáum einnig að þegar hitnar á norður hverli, þá kólnar á suðurhveli.
Hugsanlega eru heitir hafstraumar, sem fara stundum í norður þá verður heitara þar, og stundum í suður, og þá verður heitara þar.
Núverandi hita trúar menn, mæla breytinguna frá 1850 og til dagsins í dag¸og reyna að hræða fólkið með hita aukningunni.
Það var hægt að rækta korn á Íslandi árið 1000, og nú er hægt að rækta korn á Íslandi og ber að fagna því.
Í raun vitum við ekkert hvort fer að hitna eða kólna.
Þeir sem tala um hamfara hlýnun, nota hugmyndina til að gera fólkið hrætt, og fær þá fólkið til að samþykkja allskonar lög og reglur, sem henta víxlurunum, stjórnvöldum, sem hafa haldið fólkinu í fáfræði í fjósinu árþúsundum saman.
Með Internetinu hafa komið glufur í fjölmiðlaveldi víxlarana, og nú er hægt að dreifa sönnum fréttum og nýjum fróðleik framhjá aðal fréttamiðlunum.
Það verður að teljast af hinu góða.
000
Sjálfvirka þýðingarvélin, skynjar ekki alltaf mælta málið, talað mál.
Aðeins endursagt.
Myndirnar eru óskýrar.
klikka, mynd stærri

01
Árið 1850 var lægsti hiti sem verið hefur frá síðustu ísöld, (þá fundið frá ísborkjörnum, jg)
(Hamfaratrúarmenn virðast mæla frá þessu lágmarki og til dagsins í dag. jg)

2
Árið 950, er áhugavert, það er þegar Víkingarnir ákváðu að

3
setjast að á Íslandi og Grænlandi, og þá kom Litla ísöldin með lægri hita,

4
Miðað við víkingatímann, fram til ársins 1600 lækkaði hitinn um eina og hálfa gráðu að

5
meðaltali, hitnaði aftur um 18 öldina, og lækkaði síðan aftur, og var það lægsta hitastigið,

6
sem mældist um 1850. Hugsanlega hafa einhverjir ykkar séð gamlar

7
myndir af jöklum frá þeim tíma, en mundu að ljósmynda tæknin var fundin upp 1850, þannig

8
að ef þeir tóku myndir af jöklum, þá voru jöklarnir í algjöru hámarki frá síðustu ísöld.

9
Ef við viljum stöðva losun á koltvíoxíði og þvíumlíku, þá

10
Við fórum að segja að koltvíoxíð gæti haft áhrif á loftslagsbreytingar, en óskaðu ekki

11
að við fáum aftur veðrið fyrir 150 árum, lærðu

12
Um hnattstöðuna okkar, það var ansi kalt, segjum að það sé í lagi

13
Ef ég framlengi þennan feril, verða nýustu gildin hér fyrir nútímann

14
Um það bil það sama og á Víkingatímanum

15
Og nú er hægt að rækta kartöflur

16
Í Grænlandi (aftur?) En hvernig var þessu varið á suðurhvelinu?

17
Á suðurhvelinu, er allt öfugt eins og þú getur séð

18
Þú sérð strax að þegar kólnar á norðurhveli

19
Þá hitnar á suðurhveli,

20
Setjum við svo mikla losun í andrúmsloftið

21
Að breytingarnar verða hraðari? Við vitum það ekki

22
koltvísýringur og metan

23
Við vitum þetta ekki, skiljum þetta ekki

24
Hugsanlega eru heitir hafstraumar, sem fara stundum í norður þá verður heitara þar, og stundum í suður, og þá verður heitara þar.
000
Sjálfvirka þýðingarvélin, skynjar ekki alltaf mælta málið, talað mál.
Ég gef mér ekki tíma til að reyna að leiðrétta vélina.
veljum við nú svo mikið til okkar 28:05 andrúmsloftakerfi með losun okkar á 28:07 koltvísýringur og metan sem við erum 28:09 sparka þessu kerfi út af Skilton svo það 28:13 byrjar að fara að sveiflast aftur 28:17 það er vandamálið sem við þekkjum ekki núna 28:24 langar að klára með einni litlu rennibraut
Texti
00:00
I'll take you to another very famous
00:03
event here you have Vesuvius
00:07
you see Napoli the bay of Napoli masoom
00:12
is right here it will kind of come from
00:14
Google Earth of course the famous
00:17
eruption of 79 ad if you look at our
00:22
counting here again 76 78 79 its bottom
00:26
so we can say some complained you know
00:30
that our calendars wrong and during the
00:34
Dark Ages after the collapse of the
00:35
Roman Empire somebody forgot to count
00:37
the years but we feel that the Romans
00:42
were right it was 79 AD and we arrived
00:44
at the center it's a good check we are
00:46
counting the right way now let's go to a
00:52
very controversial lesson let's go to
00:55
this place I'm not talking about the
00:57
Greek bankruptcy anything I'm talking
00:59
about something italia here you have the
01:03
tiny island of Thera in the aegean sea
01:06
also a variable panic area but a lot
01:09
more explosive and more erratic and you
01:13
can see the middle east this island blew
01:16
apart sometime in the past it's called
01:19
the famous Terra or Santorini eruption
01:24
archaeologists have found lots of
01:27
pottery from the Minoan culture buried
01:29
also on Crete some of you might know
01:33
Costas and everything here and I would
01:36
have mine at all and things down here
01:39
but all this was buried and the eruption
01:42
was so big it really hurt the minimum
01:44
culture now by looking at the pottery in
01:49
the styles of pottery they know they had
01:51
a vast trade with Egypt so they had a
01:54
lot of Egyptian pottery that you find
01:56
also here in the layers just below the
01:59
ashes so they know was there when the
02:02
I starting this pottery there is a cup
02:05
this pottery is from the dynasty of
02:09
Pharaohs also because they have all the
02:11
Pharaohs of Egypt lined up in full
02:14
battle already in Nazi words don't they
02:16
have a ball way if you use this tablet
02:20
dating method of of archeology carbon-14
02:24
the first dates in indicated something
02:27
around 1500 BC so 3,500 years ago that
02:34
sort of fit in well with the Egyptian
02:37
dynasties so everything was fine by the
02:42
way is most likely also exactly the same
02:45
eruption that led to the biblical tale
02:48
of the seven plagues of Egypt because
02:52
really many of those seven plates can be
02:54
related to the authentic eruption the
02:57
eternal night asked for the the frogs
03:01
all over the place the consequences of
03:04
tsunami up through the Nile Delta all
03:06
the fathers who knew washed out that the
03:08
nagas thrown up in the houses the
03:10
mortality rate went up because of
03:12
fluoride poisoning later on it became
03:15
the firstborn of each family I think I
03:17
don't think it was that selective at
03:19
that time and when Moses led the
03:22
Israelis across into into Palestine he
03:26
actually did not cross the Red Sea but
03:29
he crossed the Red Sea which is the Nile
03:32
Delta s4 reads so he happened be much
03:36
heavily across with it with the fewest
03:38
people but when Pharaoh who came after
03:40
him he was hit by the tsunami created by
03:43
this volcano and then the Jews went
03:47
around over here following a fire column
03:51
by day and a smoke column by day and a
03:53
fire column by night yeah of course
03:56
because they could see so it all sort of
03:59
makes a little sense that there is a
04:02
core truth in these texts so that's why
04:06
it's doubly interesting to
04:08
see if we can fix this dated and Norvig
04:14
what if you go to theorem this eruption
04:17
and we look at the acid curve from it
04:20
and we look at our counting we actually
04:22
find the acid fall out that we really
04:25
believe the theorem on probably the
04:28
problem is it doesn't have a third name
04:31
that name tag on it but it happened 6042
04:35
to 6041 BC this is a hundred years and
04:41
more it's a hundred forty is off the
04:44
original days and it created a broth in
04:49
the world of classical archaeology
04:52
because now the classical archaeologists
04:55
had to move the age of certain pharaohs
04:59
then you don't move a king 150 years
05:03
like that because then you're missing a
05:06
few below and you have too many on top
05:08
so I mean you can see you have to
05:10
rewrite rewrite the phone book it was a
05:13
really big thing so of course this was
05:16
casting doubt for 20 years we were
05:18
sitting pretty alone at the side sit
05:20
yeah I don't be a climate researchers
05:21
but we have this we cannot avoid luckily
05:26
for us the latest carbon-14 days at
05:30
theory are now at 1621 BC so now we are
05:36
only twenty years apart and that's why I
05:39
say okay we don't care to discuss any
05:41
more because that's basically the same
05:43
considering the counting era we may do
05:45
and the dating uncertainty with one just
05:49
accept it so this is I think where we
05:52
also have been able to move around in
05:54
archaeology I think this is the e
05:57
fascinating because once you get into a
06:00
different subject and you start to work
06:02
with carbon-14 archaeologists and so on
06:04
life as a physicist becomes a lot more
06:07
fun and you know what I discovered one
06:10
thing archeology is definitely not annex
06:15
sighs they can easily disagree where the
06:19
two are too late for easy Joe went to
06:23
his five in Cambridge in two and two is
06:24
three knocks what I can tell you that so
06:28
another thing I would like to show you
06:30
here is what also can be revealed by us
06:32
course because the ice cores are made of
06:35
stuff from the cleanest environment in
06:37
the earth any tiny pollution that
06:40
spreads all over the northern hemisphere
06:41
will end up in Greenland as a signal in
06:44
the southern hemisphere and are
06:45
decoupled collectors force and here you
06:48
have the fallout or actually basically
06:50
it's a ratio between copper and aluminum
06:53
over 8,000 years and what you see here
06:59
is one of the earliest traces about 2500
07:05
years ago a man-made atmospheric
07:08
pollution through the mining of copper
07:14
for bronze what you see here is industry
07:18
its people the informatic melting the
07:23
metal getting metal vapours into the
07:25
atmosphere that goes to Greenland and
07:27
forced down so we can easily follow that
07:31
we can also follow the Roman economy
07:33
going up and down because we can see the
07:35
pollution of lead by the Roman digging
07:41
for silver in Spain so every time Caesar
07:44
ran out of money he makes some more
07:46
silver coins in Spain and the byproduct
07:49
that was led saw that wind-up agreement
07:52
and of course today greenin is
07:54
chock-full of the lead that we used to
07:56
put in our petrol in cars the off stops
08:00
outside of that is we can also measure
08:02
today that their lead levels are going
08:05
down because we remove the lead from the
08:07
ice as well from the from from
08:12
so let's go further back in time the
08:16
Greenland ice core from North grip
08:18
actually turned out to be a stack of
08:21
calendar years where we've been able to
08:24
count to count 60,000 years back in time
08:29
it took us 20 men years to complete the
08:33
content so it's not something you do
08:34
overnight so this you have here is a
08:39
climate curve vertical on a time scale
08:44
but remember now that all these years
08:46
are counted so we know each and every
08:48
individual year the blue curves in
08:51
interphase the isotope values want to
08:54
that side call to the other side up here
08:58
is our present climate the last 11,000
09:00
years this is where agriculture
09:02
developed this is the ice age the last
09:05
ice age and we never go into the
09:08
previous interglacial because it's done
09:10
here but you can see we have a calendar
09:13
and what we have is actually we have
09:16
occurred that reveals that back in time
09:18
the climate has flipped out a lot of
09:21
times and when you're looking from while
09:25
you find out hey our eleven thousand
09:29
years are unique not only because
09:33
they're warm but also because there's no
09:36
sixth act to the curve we have been so
09:39
dead lucky enough to have big climatic
09:41
variations and that's why I think that
09:46
the reason why human civilization
09:48
developed agriculture cities and things
09:52
like that simultaneously in China
09:55
in the Middle East and South American
09:56
things they did that because the
09:59
conditions were right
10:01
even during the Ice Age that was
10:04
intellectual capacity to do but any
10:06
agricultural tradition that I would have
10:08
started here would have been squashed by
10:11
the repeated climate change
10:13
every 2,000 years ago boom each jump
10:17
here represents a change in average
10:20
temperature agreement of about 14
10:22
degrees translate that into Europe
10:26
roughly 8 to 10 degrees on average
10:28
that's a lot so how fast did they go
10:37
well if you expand that little thing up
10:40
there which is the very termination of
10:42
the ice age it becomes a curve like this
10:44
and then it doesn't see appear so steep
10:47
anymore this is the change between ice
10:49
age and present day you see much more
10:51
details you see also a climate change
10:53
here so that's the little piece expanded
10:56
but we can expand that even further we
11:00
can study these this is the warming
11:04
coming from cold getting warmer
11:06
this is a cooling commit of cold this is
11:09
a warming again and now the Ice Age is
11:11
over actually these periods have
11:15
geological names this is called this
11:18
cold period here between the womb here
11:22
at the warm here this quarter is called
11:24
Younger Dryas this is called the pudding
11:27
and it is called the elevator also in
11:32
French
11:36
and it's fun to hear French speaking
11:38
these two words here that's rather funny
11:41
and then you have all destroyers down
11:43
here because this climatic flip-flop
11:46
called becoming warm than becoming very
11:49
cold again and becoming all mr6 that was
11:53
first discovered and described in 1901
11:59
in animal titled the clay pit a terawatt
12:05
where they made bricks they discovered
12:08
in the clay pit a lake sediment as the
12:11
first slide I showed you with mother
12:13
gray mud and dark mud
12:16
gray mud and Dartmouth so they saw heat
12:19
there's something going on in past
12:21
climate there and some guys started to
12:23
use look at the pollen and he discovered
12:25
that during this what we call the dry as
12:28
period which is called this one and down
12:30
here in Denmark they found the pollen
12:34
from the driest plant that's the last
12:37
name for the plant and aeneas is called
12:39
blue blue it is a high optic plant you
12:43
only fired on the highest mountains in
12:44
Norway today and agreement it tells you
12:48
this is Tundra no trees high Arctic
12:52
tundra so at this time Denmark was high
12:55
Arctic tundra here in Denmark was paired
12:57
to Tundra but here were about 1500 years
13:02
1500 years wood trees moved into Denmark
13:06
the Isaac left
13:08
trees moved in together mark Denmark
13:10
became beautiful lush and forested there
13:14
the climate deteriorated the trees were
13:16
wiped out and then what became grass
13:18
covered and then the ice act is kicked
13:21
back in and it became tundra for 1,000
13:24
years before the ice fed finally ended
13:27
you can imagine what stressed the
13:31
ecosystem as
13:31
under with all these very these climatic
13:34
swings and David very fast indeed we
13:39
studied the last one in detail this is
13:42
the most detailed record we have of the
13:46
ice course covering the end of the Ice
13:48
Age
13:48
this is eleven thousand eight hundred
13:50
fifty years ago
13:52
eleven thousand seven hundred years ago
13:54
so this is a hundred fifty years this is
13:56
one hundred fifty years this is three
13:58
hundred years in total
13:59
each little pin here he still thought
14:03
here is one year over here you see occur
14:07
on isotopic ratios going this way and
14:10
then jumping in level and all of a
14:11
sudden becoming that level this jump
14:14
which had completed in one year this
14:18
parameter tells us that all of a sudden
14:23
from one year to the next eleven
14:25
thousand seven hundred and thirteen
14:26
years ago fourteen years ago the wind in
14:29
Greenland started to blow from a
14:31
different direction the meteorological
14:34
system simply reorganized herself then
14:37
as a consequence of that average
14:41
temperature is increased by 14 degrees
14:44
in 25 years this is completed in 25
14:48
years
14:49
the amount of dust blown in from China
14:53
to Greenland decreased this curve as
14:56
inverse axis it decreased by a factor of
14:59
almost a hundred over 25 years and the
15:04
annual snowfall increased by a factor of
15:09
two in five years all these parameters
15:15
together indicate a massive climate
15:18
change triggered by one year to the next
15:22
change of atmospheric circulation so we
15:28
haven't read an evidence of climate
15:30
flips that happens from one year to the
15:34
next
15:35
now if you remember all the discussions
15:38
from the newspapers these
15:41
about future climate with an enhanced
15:44
greenhouse effect because we're burning
15:45
fossil fuel you will see all the models
15:49
that are shown as soft growing curves
15:51
more and more co2 more and more growing
15:55
temperatures and then they predict this
15:57
than the other but none of these models
16:01
can handle an atmosphere that actually
16:06
behaves in fixed and Spurs so should you
16:12
be scared yeah slightly because what we
16:15
are dealing with here is a system that
16:17
is unstable it only takes a little push
16:21
to make it flip and the trouble is we
16:25
don't know the triggering points and
16:27
maybe we already are operating one of
16:29
them so to give you an indication how
16:34
how is it possible to warm up Greenland
16:38
by 14 degrees in 25 years
16:40
I mean entire Greenland and not only
16:44
that this ice core record the 60,000
16:48
counted years how can I talk about
16:54
global climate based on on the corner on
16:58
a curve like this made from Greenland I
17:01
mean come on give me a break
17:03
it's only a rather ice ten centimeters
17:05
diameter and basically what it tells me
17:07
is how climate was at that exact spot
17:10
and nothing else
17:11
what about 100 kilometres away this ice
17:14
is probably the same well we have ice
17:17
cores covering not some southern
17:21
Greenland course some celebrating
17:22
courses in northern reading course and
17:24
you line them up and they tell the same
17:26
story so we assured that the whole
17:29
island agreement is involved in these
17:31
climatic changes mmm what about Europe
17:35
what about the rest
17:36
well this curve is mimicked by
17:42
stalagmites in China this curve is
17:47
mimicked by
17:49
chorus in the Bahamas so the Breeden ice
17:55
core record is the most highly resolved
18:00
reference to any geophysical geological
18:05
evidence we have on climate change all
18:07
over the northern hemisphere so it is
18:10
the carbon copy of calm climate
18:13
variations in the North so what about
18:17
the South can be compared to yeah we can
18:19
we can go on compare them here we have
18:22
the northern one missus agreement will
18:24
not lying it down again you see this is
18:27
actually the present-day planet this is
18:30
a longest record we have been playing so
18:31
far all this we put in one body is last
18:33
ice age and boom goes way up there this
18:38
is the previous integration and look at
18:40
it it's much higher than today in fact
18:45
it's from a time 125,000 years ago when
18:48
we know Greenland was 5 degrees warmer
18:49
than today and global sea levels were 5
18:53
meters higher ie less ice in Greenland
18:56
and Antarctica this may be the climate
19:00
we're heading for in the future so this
19:03
is nature's last natural parallel to a
19:08
future we might be heading for if we
19:14
compare the blue curve is now agreement
19:17
the red curve is a similar curve at the
19:19
same time scale for melodica they are
19:21
both covering one Ice Age present a
19:24
pilot and Pandorica present a climate
19:27
agreement but you can see the curves
19:29
agree on one thing that group agree on
19:32
when the ice age ends so that's a global
19:35
phenomenon they agree on when the
19:39
previous interglacial stops global
19:42
phenomenon so ice ages have such a
19:45
global both hemispheres participate but
19:49
look now at the zigzag stuff in the
19:51
middle
19:52
all these abrupt changes were one year
19:53
to the next this is something much more
19:57
choppy than the red
19:59
that's one one first logical explanation
20:02
the NAM is not the hemisphere is mainly
20:05
land and land has the ability to become
20:08
very cold and wintertime and very hot in
20:10
summertime well the southern hemisphere
20:12
is mainly water so any variation will be
20:15
much softer but let's look in detail on
20:19
them if you can come you know combine
20:21
the Wiggles so our colleagues did this
20:25
this is a great nice port again with the
20:27
wid only things 50,000 years of it or
20:29
counted then of course in an article the
20:33
trouble is you cannot really count the
20:34
years because the layers are too thin so
20:36
you have to use other dating methods so
20:39
we were stuck with one little problem
20:40
we didn't really know the age so we put
20:44
them on top with the age with you or try
20:46
to know calculate it and look like this
20:50
and then we give me a break look at the
20:54
red curve you put you slightly to the
20:56
left everything will match see that this
20:59
looks like it's offset to the right as
21:01
we push it well this top becomes that
21:04
top it can go all the way this looks off
21:07
somehow and we were tempted to do that
21:11
but luckily the bubbles help loud
21:16
because if you start to measure the
21:18
greenhouse gas methane in the box in
21:21
Greenland you get a methane greenhouse
21:24
gas comes in pressure in looking like
21:26
this I don't have all the details but
21:27
focus on these three because we have a
21:29
lot of samples from this section you can
21:31
see what we call big brother and three
21:34
sisters up here in the blue curve they
21:38
match exactly this big brother and those
21:40
three systems so when it's warm a lot of
21:44
methane is cold that's nothing but see
21:47
methane is a gas in the atmosphere so if
21:52
the methane content is highly North has
21:54
to be
21:55
because the air is mixed so let's take
21:59
the methane from the South and put on
22:02
top okay they met but they only match if
22:11
the curves are upset like that so what
22:14
we've done here is we're using their
22:16
variations in methane to synchronize the
22:19
course so we don't have to know the
22:22
exact age of the red curve because we
22:24
know where has to be put on top of the
22:26
blue one so they have to be offset like
22:30
this and now we start to understand what
22:33
the heck is going on with these very
22:36
fast climatic changes because I had we
22:39
have a problem for physicists going back
22:42
to how these happen I told you that
22:45
ingredient the temperature grew 14
22:47
degrees in 25 years in Europe they grew
22:52
technically in 25 years
22:53
stay warm all over North America the
22:56
North Atlantic temperatures grew about
22:58
10 degrees in 25 years that's a hell of
23:02
a lot of heat who is paying that bill
23:06
because the Sun didn't shine so much
23:09
more this curve tell you what's happened
23:14
we stole the heat we stole it from the
23:18
southern hemisphere it's a
23:20
redistribution of heat that's already
23:23
there every time it's cold in Greenland
23:28
the southern hemisphere warms up and as
23:32
soon as the heat kicks in an ingredient
23:34
the summit the fellow hemisphere cools
23:37
down it's like a seesaw in fact that is
23:43
what we have called that bipolar seesaw
23:46
it's the seesaw of energy going from
23:49
north to south from south to north all
23:52
controlled by the big ocean currents and
23:55
the coupling to the atmosphere
23:58
so in order to trigger these very very
24:02
massive climate events in the northern
24:05
hemisphere
24:06
you only need one little goblin with a
24:13
hand on the damn first thermostat at the
24:16
equator and you can turn the warm
24:18
equator water north or south it's in the
24:22
south north occult said it north the
24:24
South Pole that's what happened and
24:28
that's why we can explain how a tiny
24:30
little change can really make big
24:34
consequences do does this bipolar seesaw
24:40
exist today and for that purpose we go
24:44
back in detail to see in our present
24:46
very stable climate I showed you there
24:49
were hardly any variations but if we go
24:52
with a magnifying glass and look at the
24:54
last ten thousand years or eight
24:56
thousand seven thousand years in this
24:57
place this is five thousand years BC
25:01
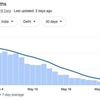
this is 180 this is now so this is seven
25:08
thousand years this is actually spends
25:09
the entire history of human civilization
25:13
the blue curve behind me is temperatures
25:17
and they are real temperatures you can
25:20
see them here in the black numbers minus
25:24
32 minus 31 minus 30 this is Stone Age
25:30
coming into the a production Empire 5000
25:33
first pyramids then during the Bronze
25:35
Age not a hemisphere cools down
25:39
he had a minimum right here the Roman
25:41
ages I think part of the all the wars
25:45
that the Romans had to fight along the
25:46
borders and all the people moving around
25:48
was because it was so cold and northern
25:51
in the northern wastes and at least
25:53
to the east that there was a pressure to
25:56
come to southern Europe they warmed up
26:00
this is 950 interesting spot because
26:06
that's when the Vikings decided to
26:08
settle in Iceland in Greenland and then
26:11
came the Little Ice Age boom and drop
26:14
from the Viking images to sixteen
26:17
hundred of one and a half degrees on
26:21
average warming up in the 18th century
26:25
and a dip again that this is the lowest
26:28
point on record eighteen hundred and
26:30
fifty probably some of you have seen old
26:35
photographs and glaciers now remember
26:40
photography was invented 1850 so if they
26:44
took pictures of glaciers they took them
26:46
at their biggest since the last ice age
26:50
so when we want to stop emission of
26:54
carbon dioxide and things like that it's
26:56
finally started knitting carbon dioxide
26:58
to halt climate change but don't wish
27:01
yourself back to one hundred and fifty
27:04
years ago at least learn in these
27:06
latitudes because it was really cold
27:08
novel I think it's okay so it's not
27:11
actually if I extend this curve the most
27:15
recent points is that we are actually
27:17
about here now so almost matching how it
27:22
was during the Viking ages and tell you
27:24
what they started to grow potatoes in
27:26
Greenland again no this variation is
27:32
interesting how did it look in the
27:34
southern hemisphere like that that's
27:38
from an anarchic Court and you can see
27:42
even in our quiet time you can see the
27:45
seesaw when it's cooling in the north
27:47
it's warming in the south when it warms
27:49
up in the north it's cooling in the
27:51
South vice-versa so there's the
27:58
five policies of silver the trouble is
28:02
do we now pick so much to our
28:05
atmospheric system with our emissions of
28:07
carbon dioxide and methane that we are
28:09
kicking this system out of Skilton so it
28:13
starts to go cell oscillating again
28:17
that's the trouble we don't know now I
28:24
want to finish with one little slide
28:29
this littlest thing last year we hit
28:32
bedrock at me and this is you see based
28:35
on debris coming up was the ice and if
28:41
we do some analysis on this I'll show
28:44
you to you oh there's too many pictures
28:46
her
Egilsstaðir, 23.08.2019 Jónas Gunnlaugsson
 Bloggar | Breytt 24.8.2019 kl. 13:17 | Slóð | Facebook | Athugasemdir (0)